Study notes
Machine learning models can encapsulate unintentional bias and that leads to unfairness.
- Approval for a loan, insurance, or other financial services.
- Acceptance into a school or college course.
- Eligibility for a medical trial or experimental treatment.
- Inclusion in a marketing promotion.
- Selection for employment or promotion.
- and more...
Disparity in predictions
One way to start evaluating the fairness of a model is to compare predictions for each group within a sensitive feature.
When you train a machine learning model using a supervised technique, like regression or classification, you use metrics achieved against hold-out validation data to evaluate the overall predictive performance of the model.
To evaluate the fairness of a model, you can apply the same predictive performance metric to subsets of the data, based on the sensitive features on which your population is grouped, and measure the disparity in those metrics across the subgroups.
When you find a disparity between prediction rates or prediction performance metrics across sensitive feature groups, it's worth considering potential causes:
- Data imbalance
Some groups may be overrepresented in the training data, or the data may be skewed so that cases within a specific group aren't representative of the overall population. - Indirect correlation
The sensitive feature itself may not be predictive of the label, but there may be a hidden correlation between the sensitive feature and some other feature that influences the prediction. - Societal biases
Subconscious biases in the data collection, preparation, or modeling process may have influenced feature selection or other aspects of model design.
Mitigating bias
Optimizing for fairness in a machine learning model is a sociotechnical challenge.
Strategies you can adopt to mitigate bias:
- Balance training and validation data
You can apply over-sampling or under-sampling techniques to balance data and use stratified splitting algorithms to maintain representative proportions for training and validation. - Perform extensive feature selection and engineeringanalysis.
Make sure you fully explore the interconnected correlations in your data to try to differentiate features that are directly predictive from features that encapsulate more complex, nuanced relationships. You can use the model interpretability support in Azure Machine Learning to understand how individual features influence predictions. - Evaluate models for disparity based on significantfeatures.
You can't easily address the bias in a model if you can't quantify it. - Trade-off overall predictive performance for the lower disparity in predictive performance between sensitive feature groups
A model that is 99.5% accurate with comparable performance across all groups is often more desirable than a model that is 99.9% accurate but discriminates against a particular subset of cases.
Python package that you can use to analyze models and evaluate disparity between predictions and prediction performance for one or more sensitive features.
- includes a MetricFrame function that enables you to create a dataframe of multiple metrics by the group.
- provides an interactive dashboard widget that you can use in a notebook to display group metrics for a model.
widget enables you to choose a sensitive feature and performance metric to compare, and then calculates and visualizes the metrics and disparity
- Train and evaluate any model like usual.
- Define one or more sensitive features in your dataset with which you want to group subsets of the population and compare selection rate and predictive performance
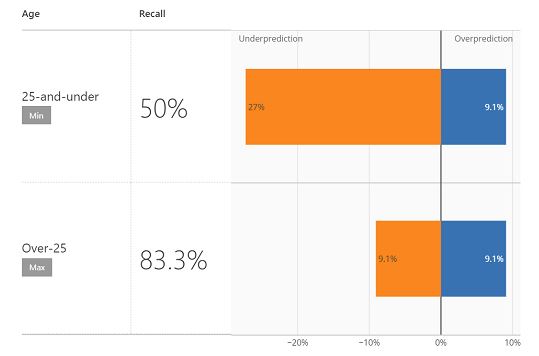
Chart samples:
 You can analyze disparity inselection rates and predictive performance across sensitive features,
Mitigating unfairness in models with Fairlearn
The mitigation support in Fairlearn is based on the use of algorithms to create alternative models that apply parity constraints to produce comparable metrics across sensitive feature groups.
Techniques:
- Exponentiated Gradient
A reduction technique that applies a cost-minimization approach to learning the optimal trade-off of overall predictive performance and fairness disparity.
Binary classification and regression - Grid Search
A simplified version of the Exponentiated Gradient algorithm that works efficiently with small numbers of constraints.
Binary classification and regression - Threshold Optimizer
A post-processing technique that applies a constraint to an existing classifier, transforming the prediction as appropriate.
Binary classification
- Demographic parity
Use this constraint with any of the mitigation algorithms to minimize disparity in the selection rate across sensitive feature groups.
Ex: in a binary classification scenario, this constraint tries to ensure that an equal number of positive predictions are made in each group. - True positive rate parity
Use this constraint with any of the mitigation algorithms to minimize disparity in true positive rate across sensitive feature groups.
Ex:, in a binary classification scenario, this constraint tries to ensure that each group contains a comparable ratio of true positive predictions. - False-positive rate parity
Use this constraint with any of the mitigation algorithms to minimize disparity in false_positive_rate across sensitive feature groups.
Ex: in a binary classification scenario, this constraint tries to ensure thateach group contains a comparable ratio of false-positive predictions. - Equalized odds
Use this constraint with any of the mitigation algorithms to minimize disparity in combined true positive rate and false_positive_rate across sensitive feature groups.
Ex: in a binary classification scenario, this constraint tries to ensure that each group contains a comparable ratio of true positive and false-positive predictions. - Error rate parity
Use this constraint with any of the reduction-based mitigation algorithms (Exponentiated Gradient and Grid Search) to ensure that the error for each sensitive feature group does not deviate from the overall error rate by more than a specified amount. - Bounded group loss
Use this constraint with any of the reduction-based mitigation algorithms to restrict the loss for each sensitive feature group in a regression model.
- Use one algorithm and one constraint to train multiple models
- Compare their performance, selection rate, and disparity metrics to find the optimal model for your needs
Resource:
Detect and mitigate unfairness in models with Azure Machine Learning - Training | Microsoft Learn
References: